The ocean is the flywheel that propels the climate system, storing huge amounts of heat and carbon in a vast reservoir that covers 70 percent of Earth’s surface. Measuring changes in that heat content over time has been a subject of intense scientific research, with analyses growing more precise as observing systems expand and the duration of measurements grows.
In a new article published in the journal Nature Climate Change, Gregory Johnson, a NOAA scientist at the Pacific Marine Environmental Laboratory and his colleague in Seattle analyzed four prominent ocean temperature datasets and found that over the past 52 years, the area of ocean regions showing long-term warming trends dwarfs that of regions showing cooling trends.
Tracking ocean temperatures has long been a focus of Johnson and John Lyman, a scientist with the Joint Institute for Marine and Atmospheric Research, a partnership between the University of Hawaii and NOAA. For 15 years, they have led an analysis of ocean temperatures for the annual State of the Climate report published in the Bulletin of the American Meteorological Society.
“Ocean warming is tightly linked to increases in atmospheric greenhouse gases concentrations, so global ocean temperature trends are an important yardstick for measuring climate change,” said Johnson. “We noticed that as the time-series of upper ocean heat content we were analyzing grew over the years, more of the ocean area was covered by a statistically significant warming trend.”
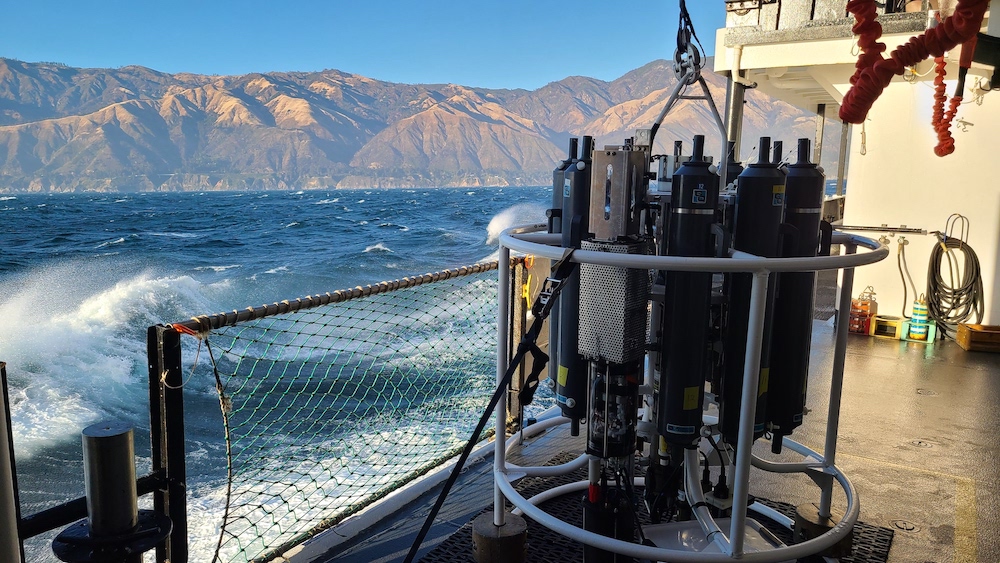
Johnson and Lyman decided to step back and look at how temperature trends changed when estimated over varying time periods. To investigate those questions, the pair generated annual maps of ocean heat content anomalies in the upper 700 meters of ocean from 1993 to 2019 by combining sea-level data from satellite altimeters with ocean temperature data. They also analyzed annual maps of ocean temperature data from the upper 700 meters from 1968 to 2019 from three other research groups: NOAA’s National Center for Environmental Information, the Japan Meteorological Agency, and the Chinese Academy of Science’s Institute of Atmospheric Physics.
Strong warming signal emerges from longer time series
For the 27-year period 1993 to 2019, they found 53 percent of the global ocean exhibited statistically significant warming trends versus 3 percent of the ocean showing significant cooling trends. For the 52-year period from 1968 to 2019, the imbalance grew markedly: 72 to 79 percent of the ocean area showed warming, while only 1 to 3 percent exhibited cooling. When trends were estimated over shorter 5-year periods, the areas and imbalances were much smaller, with 24% warming and 17% cooling.
“As we increase the time period over which we estimate ocean heat content trends, the portion of the global ocean where we can detect warming trends steadily grows, while the cooling trends steadily shrinks,” said Lyman.
According to the International Panel on Climate Change, around 93 percent of the excess energy trapped in the Earth system by greenhouse gas pollution from 1971 to 2010 was absorbed by the oceans – delaying atmospheric warming substantially. Three percent was expended melting ice, another 3 percent warmed the land, and only 1 percent warmed and moistened the atmosphere.
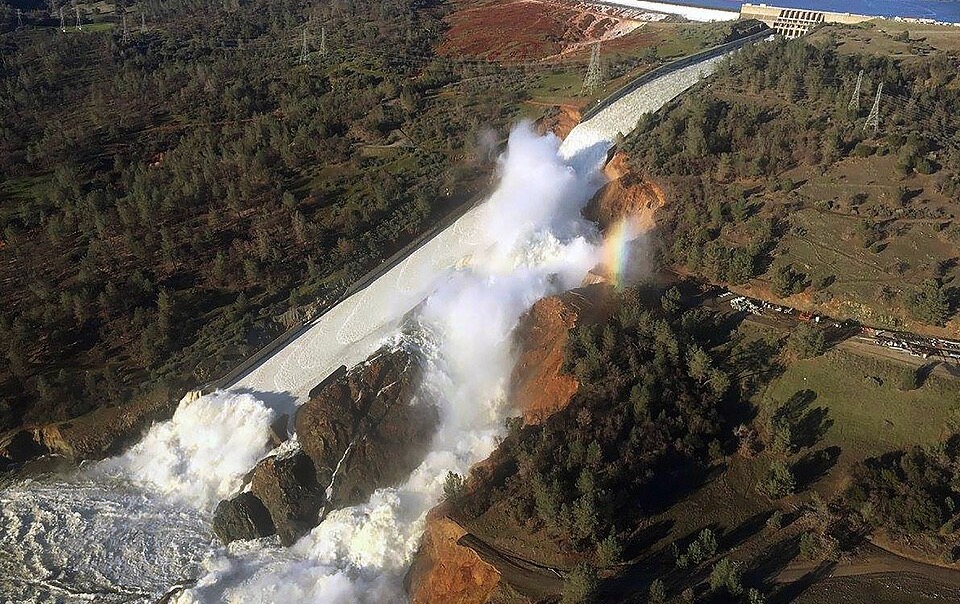
While the ocean has soaked up the overwhelming majority of greenhouse warming, it hasn’t come without costs. Warmer water occupies more space than cooler water, and about 42 percent of sea level rise documented since 1993 is due to thermal expansion caused by global warming.
Rising ocean temperatures are also associated with increased marine heatwaves, which in turn can devastate coral reefs, dislocate or disrupt distributions of important fish species, and increase vertical ocean stratification, which reduces nutrients in surface water, and decreases dissolved oxygen at depth, both of which affect ecosystems, fisheries, and possibly even ocean carbon storage. Rising ocean temperatures can also influence changes in the climate and promote rapid intensification of tropical cyclones.
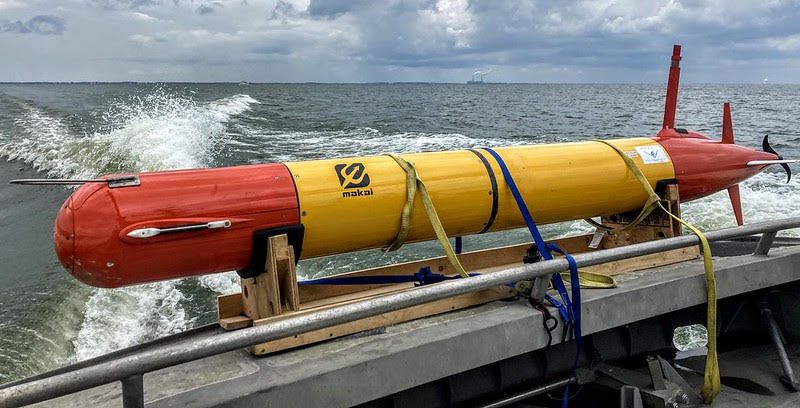
“The global array of Argo autonomous profiling floats and long-term satellite measurements have greatly improved observations of this watery planet, Earth, allowing huge strides in understanding how its oceans, on which we depend in so many ways, are changing,” said Johnson.
For more information, contact Theo Stein, NOAA Communications, at theo.stein@noaa.gov.