Levels of the three most important human-caused greenhouse gases – carbon dioxide (CO2), methane and nitrous oxide – continued their steady climb during 2023, according to NOAA scientists.
While the rise in the three heat-trapping gases recorded in the air samples collected by NOAA’s Global Monitoring Laboratory (GML) in 2023 was not quite as high as the record jumps observed in recent years, they were in line with the steep increases observed during the past decade.
“NOAA’s long-term air sampling program is essential for tracking causes of climate change and for supporting the U.S. efforts to establish an integrated national greenhouse gas measuring, monitoring and information system,” said GML Director Vanda Grubišić. “As these numbers show, we still have a lot of work to do to make meaningful progress in reducing the amount of greenhouse gases accumulating in the atmosphere.”
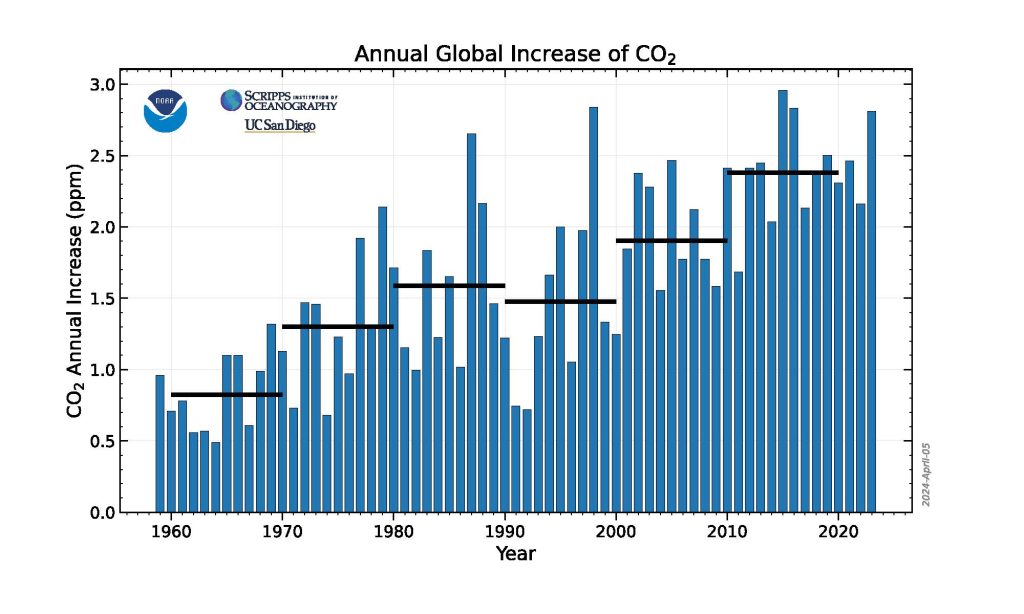
The global surface concentration of CO2, averaged across all 12 months of 2023, was 419.3 parts per million (ppm), an increase of 2.8 ppm during the year. This was the 12th consecutive year CO2 increased by more than 2 ppm, extending the highest sustained rate of CO2 increases during the 65-year monitoring record. Three consecutive years of CO2 growth of 2 ppm or more had not been seen in NOAA’s monitoring records prior to 2014. Atmospheric CO2 is now more than 50% higher than pre-industrial levels.
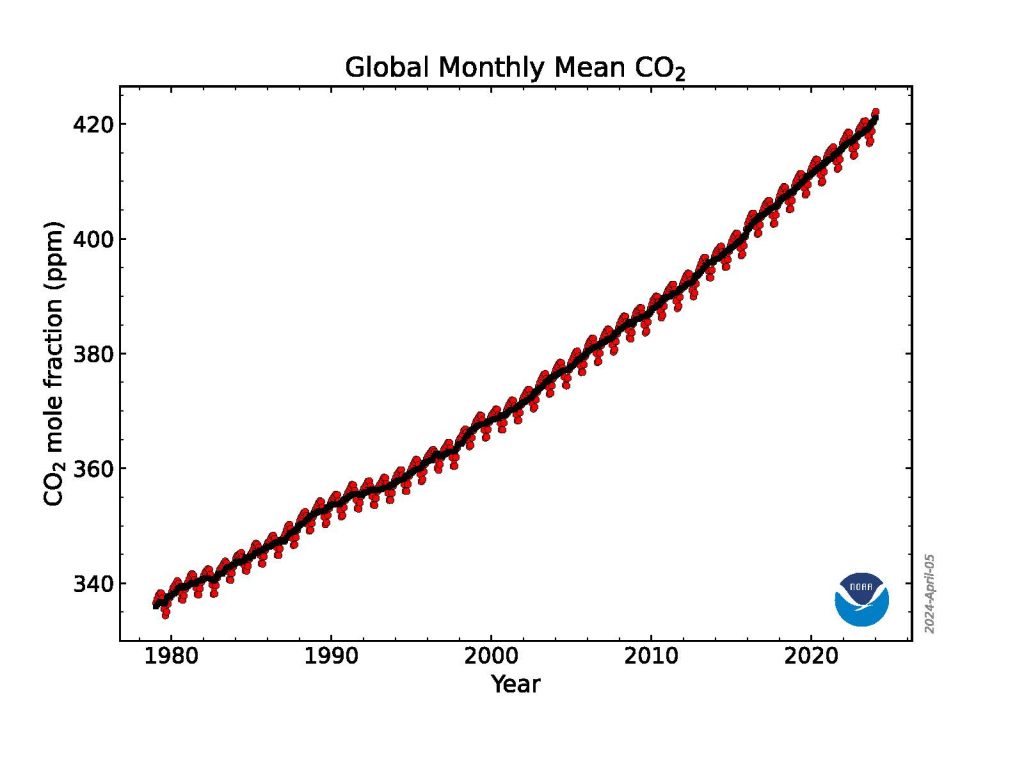
This graph shows the globally averaged monthly mean carbon dioxide abundance measured at the Global Monitoring Laboratory’s global network of air sampling sites since 1980. Data are still preliminary, pending recalibrations of reference gases and other quality control checks. Credit: NOAA GML
“The 2023 increase is the third-largest in the past decade, likely a result of an ongoing increase of fossil fuel CO2 emissions, coupled with increased fire emissions possibly as a result of the transition from La Nina to El Nino,” said Xin Lan, a CIRES scientist who leads GML’s effort to synthesize data from the NOAA Global Greenhouse Gas Reference Network for tracking global greenhouse gas trends.
Atmospheric methane, less abundant than CO2 but more potent at trapping heat in the atmosphere, rose to an average of 1922.6 parts per billion (ppb). The 2023 methane increase over 2022 was 10.9 ppb, lower than the record growth rates seen in 2020 (15.2 ppb), 2021(18 ppb) and 2022 (13.2 ppb), but still the 5th highest since renewed methane growth started in 2007. Methane levels in the atmosphere are now more than 160% higher than their pre-industrial level.
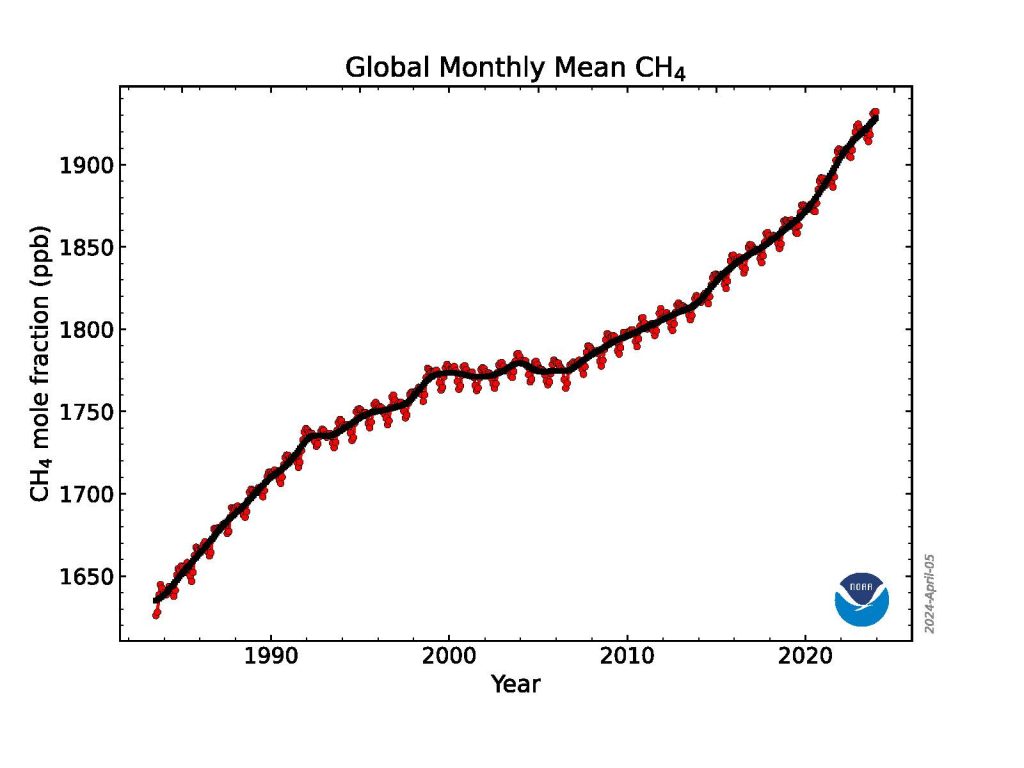
This graph shows globally-averaged, monthly mean atmospheric methane abundance determined from marine surface sites for the full NOAA time-series starting in 1983. Values for the last year are preliminary, pending recalibrations of standard gases and other quality control steps. Credit: NOAA GM
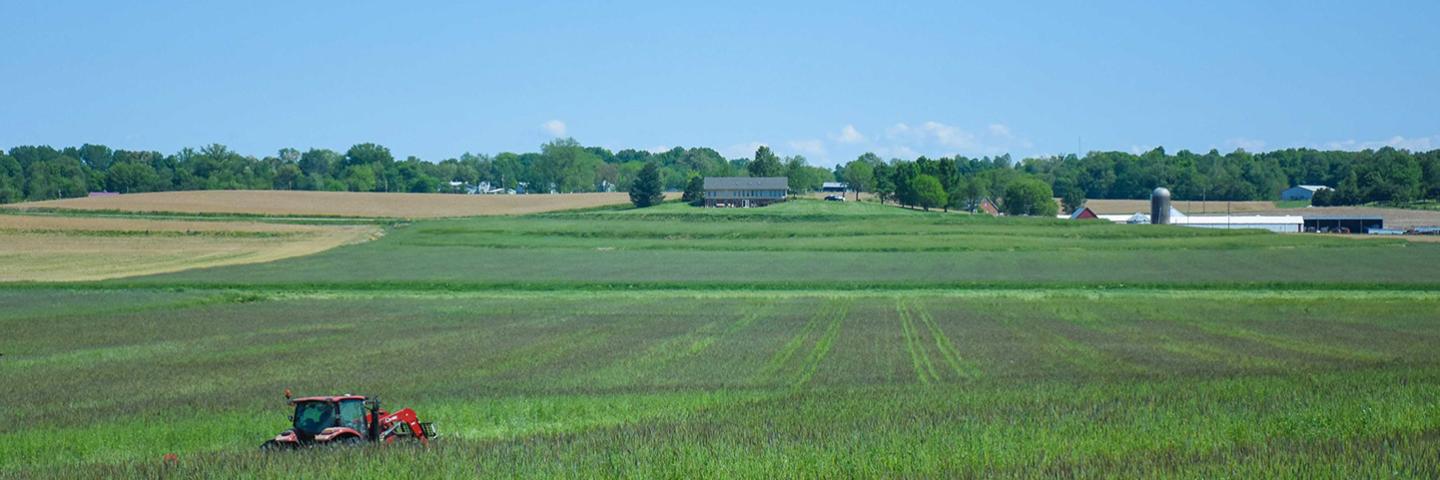
In 2023, levels of nitrous oxide, the third-most significant human-caused greenhouse gas, climbed by 1 ppb to 336.7 ppb. The two years of highest growth since 2000 occurred in 2020 (1.3 ppb) and 2021 (1.3 ppb). Increases in atmospheric nitrous oxide during recent decades are mainly from use of nitrogen fertilizer and manure from the expansion and intensification of agriculture. Nitrous oxide concentrations are 25% higher than the pre-industrial level of 270 ppb.
Taking the pulse of the planet one sample at a time
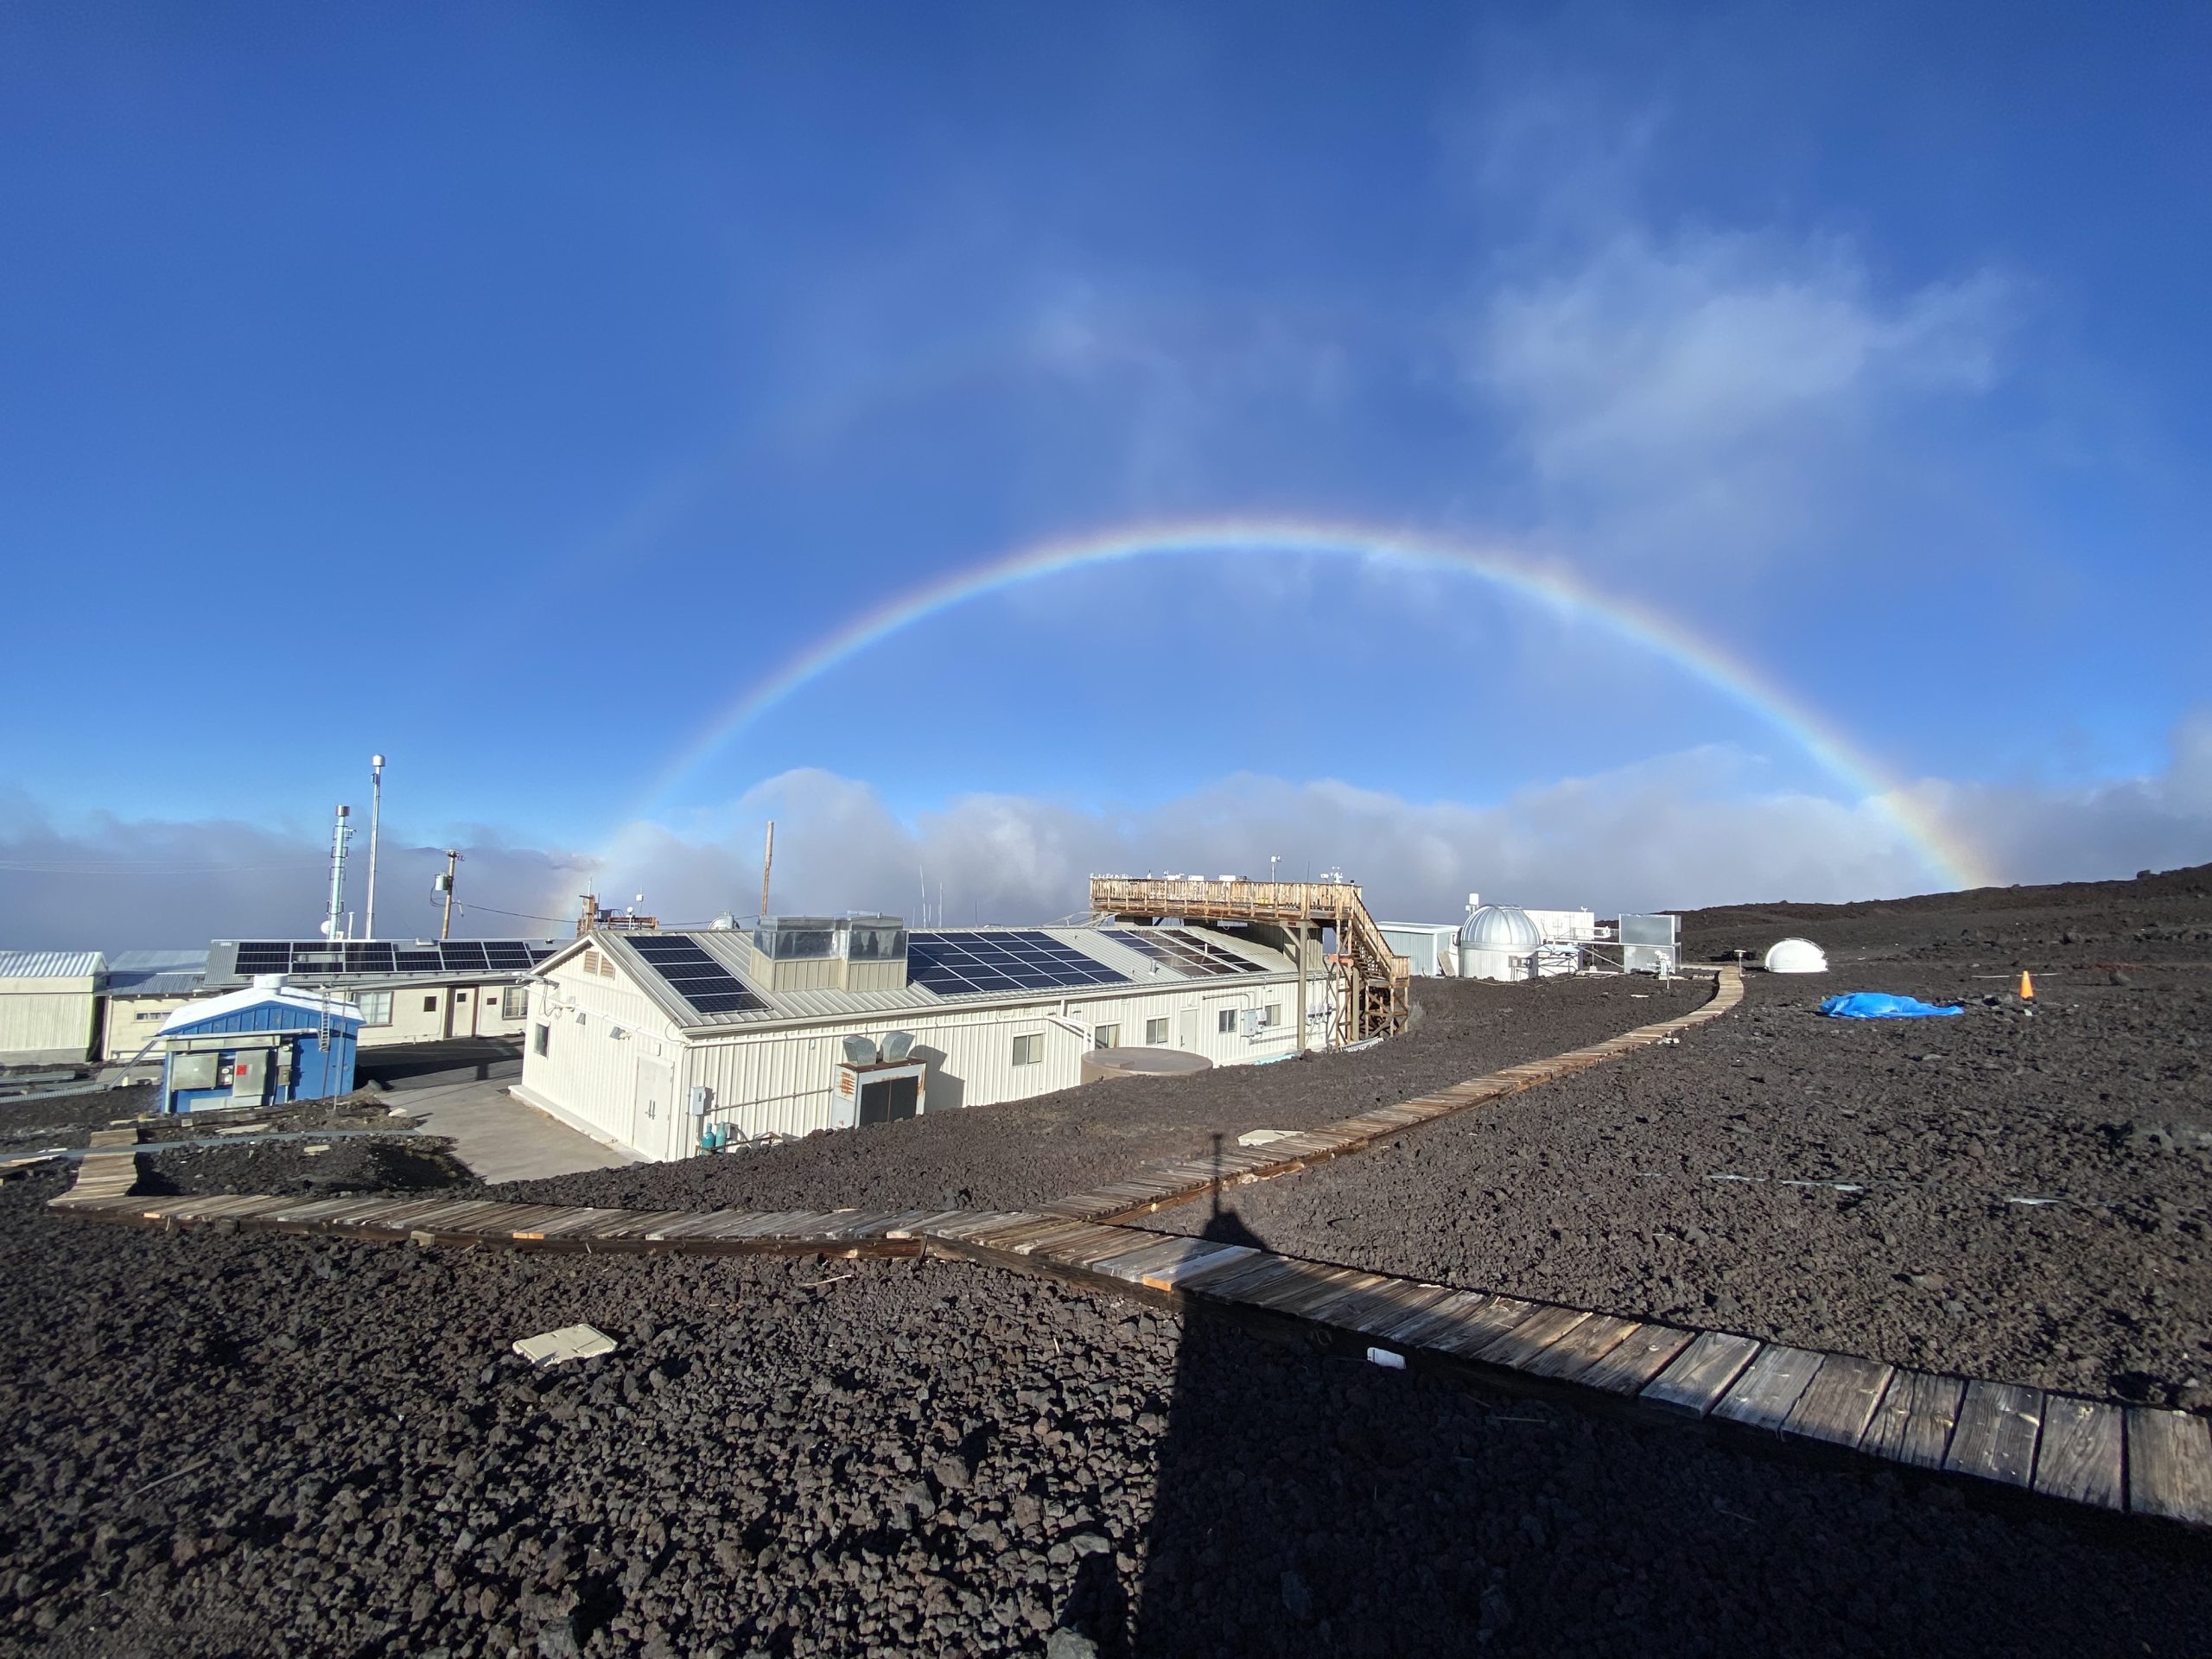
NOAA’s Global Monitoring Laboratory collected more than 15,000 air samples from monitoring stations around the world in 2023 and analyzed them in its state-of-the-art laboratory in Boulder,
Colorado. Each spring, NOAA scientists release preliminary calculations of the global average levels of these three primary long-lived greenhouse gases observed during the previous year to track their abundance, determine emissions and sinks, and understand carbon cycle feedbacks.
Measurements are obtained from air samples collected from sites in NOAA’s Global Greenhouse Gas Reference Network, which includes about 53 cooperative sampling sites around the world, 20 tall tower sites, and routine aircraft operation sites from North America.
Carbon dioxide emissions remain the biggest problem
By far the most important contributor to climate change is CO2 , which is primarily emitted by burning of fossil fuels. Human-caused CO2 pollution increased from 10.9 billion tons per year in the 1960s – which is when the measurements at the Mauna Loa Observatory in Hawaii began – to about 36.8 billion tons per year in 2023. This sets a new record, according to the Global Carbon Project, which uses NOAA’s Global Greenhouse Gas Reference Network measurements to define the net impact of global carbon emissions and sinks.
The amount of CO2 in the atmosphere today is comparable to where it was around 4.3 million years ago during the mid-Pliocene epoch, when sea level was about 75 feet higher than today, the average temperature was 7 degrees Fahrenheit higher than in pre-industrial times, and large forests occupied areas of the Arctic that are now tundra.
About half of the CO2 emissions from fossil fuels to date have been absorbed at the Earth’s surface, divided roughly equally between oceans and land ecosystems, including grasslands and forests. The CO2 absorbed by the world’s oceans contributes to ocean acidification, which is causing a fundamental change in the chemistry of the ocean, with impacts to marine life and the people who depend on them. The oceans have also absorbed an estimated 90% of the excess heat trapped in the atmosphere by greenhouse gases.
Research continues to point to microbial sources for rising methane
NOAA’s measurements show that atmospheric methane increased rapidly during the 1980s, nearly stabilized in the late-1990s and early 2000s, then resumed a rapid rise in 2007.
A 2022 study by NOAA and NASA scientists and additional NOAA research in 2023 suggests that more than 85% of the increase from 2006 to 2021 was due to increased microbial emissions generated by livestock, agriculture, human and agricultural waste, wetlands and other aquatic sources. The rest of the increase was attributed to increased fossil fuel emissions.
“In addition to the record high methane growth in 2020-2022, we also observed sharp changes in the isotope composition of the methane that indicates an even more dominant role of microbial emission increase,” said Lan. The exact causes of the recent increase in methane are not yet fully known.
NOAA scientists are investigating the possibility that climate change is causing wetlands to give off increasing methane emissions in a feedback loop.
To learn more about the Global Monitoring Laboratory’s greenhouse gas monitoring, visit: https://gml.noaa.gov/ccgg/trends/.
Media Contact: Theo Stein, theo.stein@noaa.gov, 303-819-7409