Greenhouse gas pollution from human activity trapped 49 percent more heat in the atmosphere during 2022 than those same gases did in 1990, according to an annual NOAA report.
NOAA’s Annual Greenhouse Gas Index, known as the AGGI, tracks increases in the warming influence of heat-trapping gases generated by human activity, including carbon dioxide, methane, nitrous oxide, chlorofluorocarbons, and 15 other gases. The AGGI converts the complex scientific computations of how much extra heat these gases capture, also known as radiative forcing, into a single number that can easily be compared to previous years.


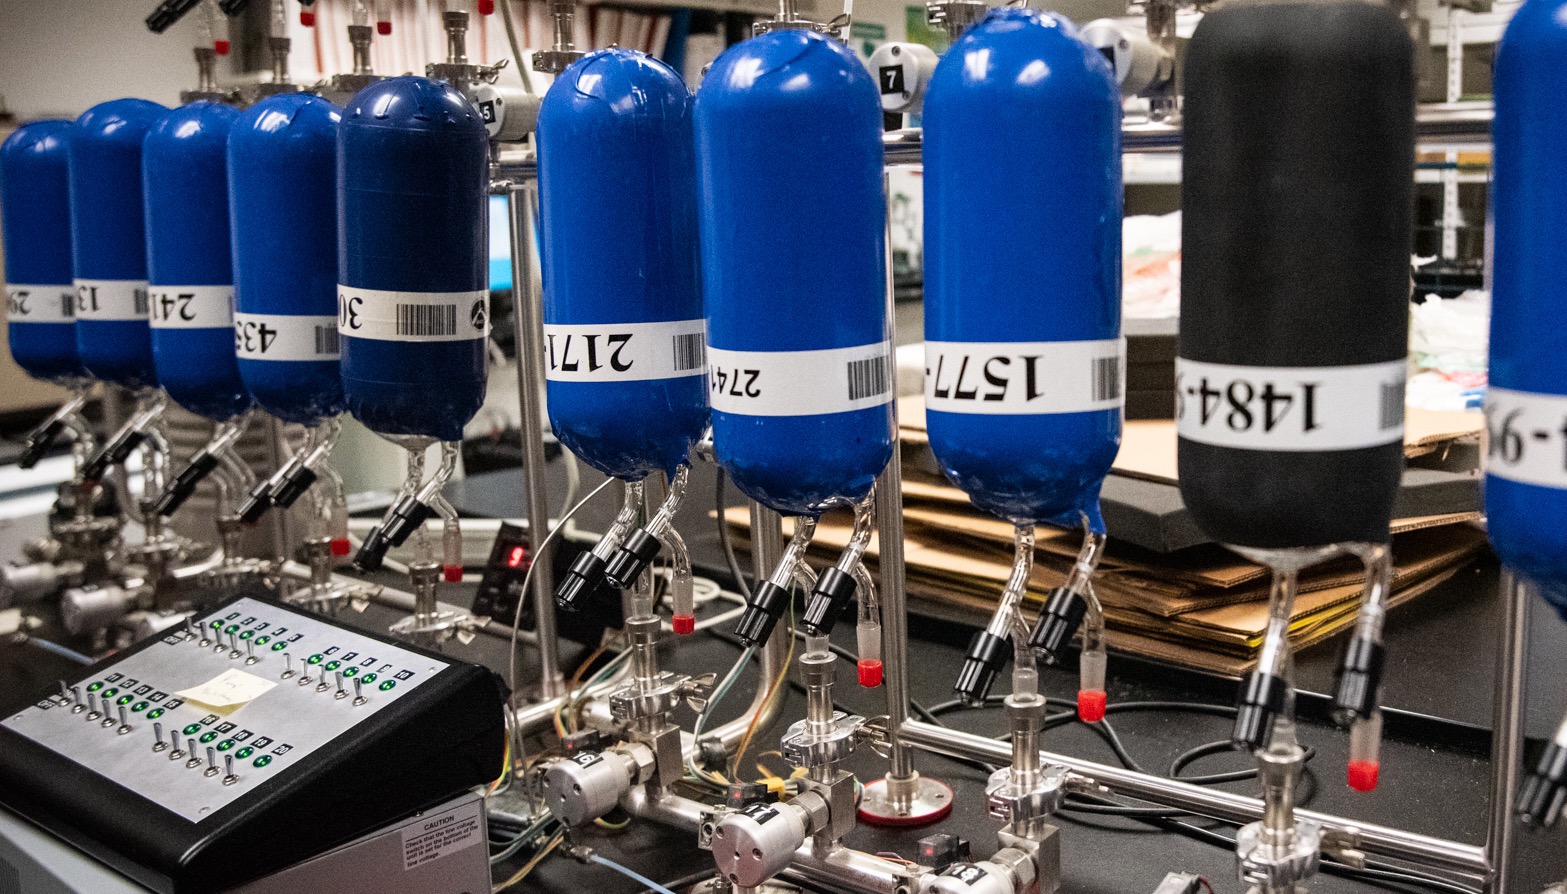
“The AGGI is derived from highly accurate measurements of greenhouse gases in air samples collected around the world,” said Vanda Grubišić, Ph.D, director of NOAA’s Global Monitoring Laboratory (GML). “It continues to rise despite international efforts to curb emission of greenhouse gases from fossil fuels that seem to be falling short of their targets.”
Grubišić reported results of the 2022 AGGI during the opening session of the 51st Global Monitoring Annual Conference.
In 2006, NOAA scientists with GML developed the AGGI as a way to help policymakers, educators and the public appreciate the cumulative direct impact of rising greenhouse gas levels on Earth’s climate since the onset of the industrial era.


The index is benchmarked to a value of 1.0 for the year 1990, the baseline year for Kyoto Protocol emission reductions. In 2022, the AGGI rose to a value of 1.49, an increase consistent with previous years. That means that the contribution to warming from long-lived greenhouse gases in the atmosphere in 2022 was 49% higher than in 1990.
Carbon dioxide (CO2) remains by far the largest contributor to total radiative forcing from these gases, with methane the second largest contributor. While the global mean abundance of CO2 in 2022 was 417 parts per million (ppm), the cumulative warming influence of all the gases included in the AGGI was equivalent to 523 ppm of CO2.
Calculation updated to reflect improved understanding of radiative forcing
In its Sixth Assessment Report in 2021, the IPCC updated the method it uses to calculate the amount of heat trapped by the observed levels of greenhouse gases in the atmosphere. NOAA has always used IPCC recommendations in the calculation of its AGGI.
The 2021 revisions from IPCC primarily address improvements in radiative forcing calculations due to updated spectroscopic measurements. As a result, GML recalculated AGGI values for all preceding years so there are no artificial step changes in the long-term record. The recalculated 2021 AGGI value is 1.47 instead of the 1.49 calculated with the previous method. The revised 2020 AGGI value is 1.45 instead of 1.47.


“The change in method does not change any of the conclusions,” said Stephen Montzka, GML’s senior scientist. “The AGGI continues to provide an easily understandable way to track the increasing amount of heat being trapped in the atmosphere by greenhouse gas pollution.”
The biggest culprit
Roughly 36 billion metric tons of CO2 are emitted each year by transportation, electrical generation, cement manufacturing, deforestation, agriculture, and many other practices. A substantial fraction of CO2 emitted today will persist in the atmosphere for more than 1,000 years. The global average of atmospheric CO2 has risen by 63 ppm since 1990, accounting for 77% of the increased heat tracked by the AGGI since that year.
Cause of methane’s rapid rise emerging?
Levels of atmospheric methane, or CH4, averaged 1,911.8 parts per billion (ppb) during 2022, or around two and half times greater than pre-industrial levels. The 14.1 ppb increase recorded during 2022 was the third-fastest observed since the early 1980s. Causes for the dramatic post-2007 increase are not fully understood, but research by NOAA and CIRES scientists point to a dominant increase in emissions from microbial sources such as wetlands, agriculture and landfills, and a smaller increase in methane emissions from the fossil fuel sector.
Nitrous oxide rise also near record levels
Levels of the third-most important anthropogenic greenhouse gas, nitrous oxide or N2O, rose to 335.7 ppb, a 24% increase over its pre-industrial level. The 1.25 ppb increase last year is the third-largest jump since 2000. Increases in atmospheric nitrous oxide during recent decades are mainly from use of nitrogen fertilizer and manure from the expansion and intensification of agriculture.
“Alternative energy sources to replace fossil fuels exist,” said Montzka, the GML scientist who leads the AGGI report each year, “but cutting emissions associated with producing food is perhaps an even more difficult task.”
For more information, contact Theo Stein, NOAA Communications, at theo.stein@noaa.gov.


