By Katie Valentine
For 50 years, scientists at NOAA have been conducting research that helps us understand our planet and address its biggest challenges. From tracking carbon dioxide levels in the atmosphere to exploring the depths of the ocean, NOAA scientists are collecting critical information on the planet’s health.
This year, in celebration of Earth Day, we’re taking a look back at some of the biggest steps we’ve taken in the last 50 years that have revolutionized the way we gather planetary data.
Dove into deep-sea exploration with Okeanos Explorer
Good ocean management starts with knowing what’s out there. With that in mind, in 2008, NOAA commissioned NOAA Ship Okeanos Explorer as the agency’s official ocean exploration vessel. In the 11 years since the first data was collected, scientists participating in the Okeanos Explorer expeditions have discovered new species — up to 50 in one 2010 mission alone — and unearthed new underwater habitats. These expeditions have also uncovered aspects of deep-sea geology that impact the carbon dioxide and methane levels in our ocean. Since 2012, for instance, scientists have discovered hundreds of methane seeps in the Atlantic seafloor, sources of this potent greenhouse gas that impact our planet’s total greenhouse gas budget.
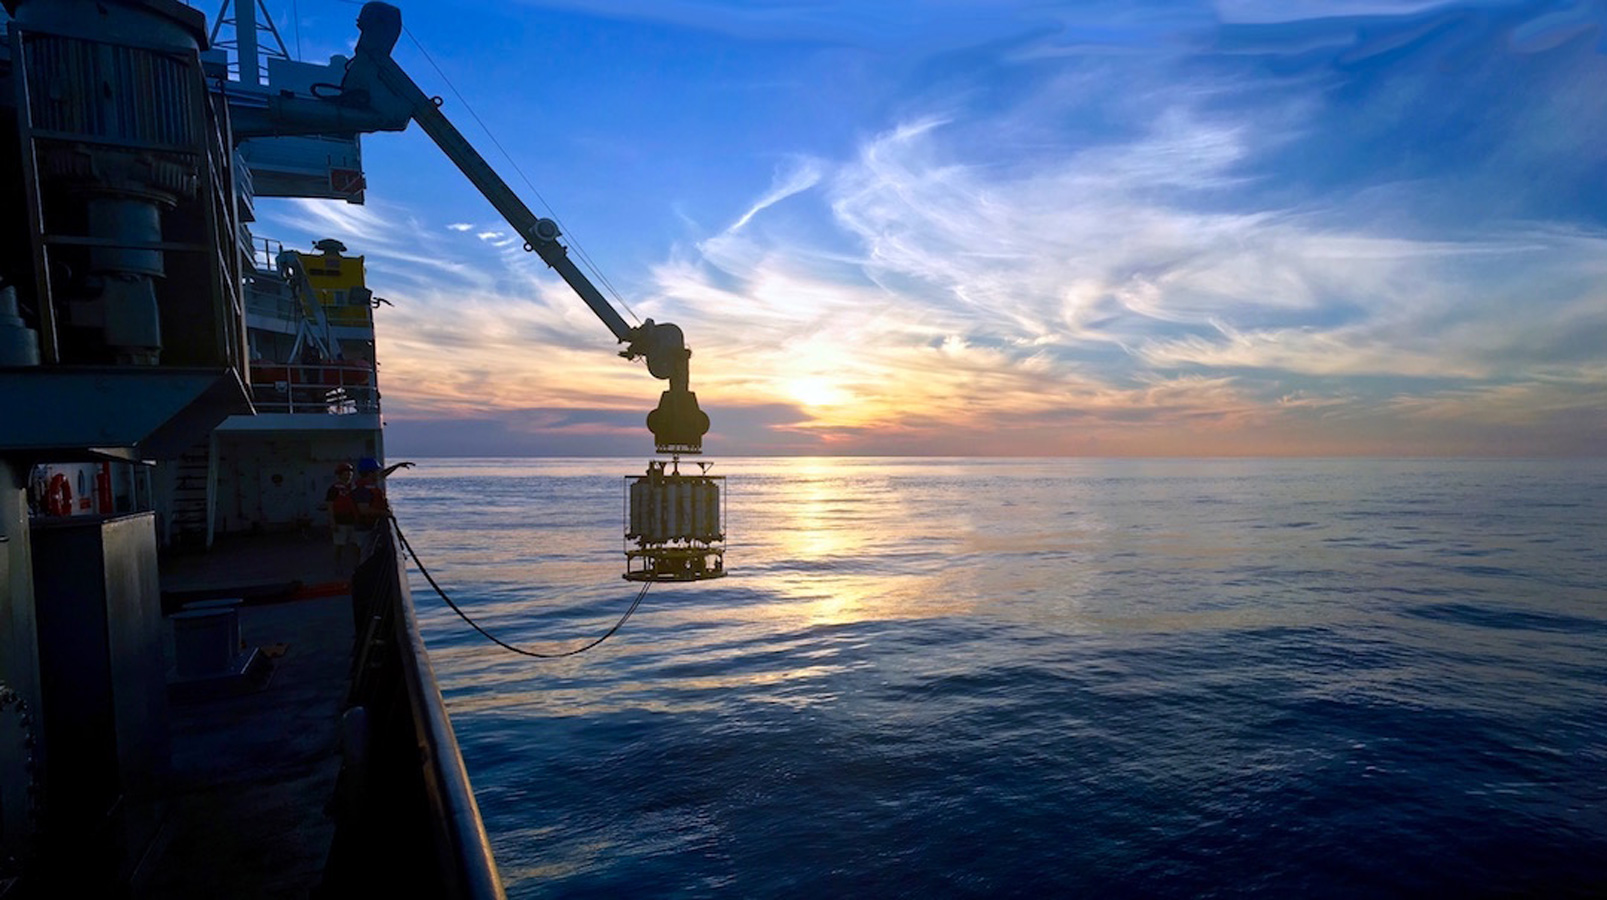
Launched the Argo Program to monitor ocean health
In 1999, NOAA and partner organizations from around the world established the Argo Program, a network of battery-powered, autonomous floats that drift throughout the ocean, taking measurements of temperature and salinity. Now, the Argo Program is composed of about 4,000 robotic floats that take measurements of the top 2,000 meters (about 1.2 miles) of the ocean. Before the Argo Program, scientists mostly got their ocean data from satellites, research ships, and anchored tools like moored buoys. The Argo Program ushered in a new era of ocean observation, with the cylindrical floats providing nearly four times as much information on ocean health as all other ocean observing tools combined.
The Argo Program has come a long way since 1999. In 2018, it celebrated the 2 millionth measurement taken by an Argo float. And Argo is expanding: Scientists are testing deep Argo floats, which can dive down to 3.7 miles below the ocean surface, and biogeochemical Argo floats that can measure ocean oxygen, nitrate, pH levels, and more. Data collected from Argo floats are publicly available and used in weather and climate forecast models and research, as well as in classroom tools to teach about climate. With these new Argo programs in development, scientists and the public will soon have even more vital ocean data to learn from and explore.
Developed tools to keep drinking water safe
The Great Lakes supplies drinking water for more than 40 million people in the U.S. and Canada. They also provide 56 billion gallons of water per day for municipal, agricultural, and industrial use. The value of the Great Lakes cannot be overstated, as billions of dollars of international economic activity are directly tied to the region’s Blue Economy. At NOAA’s Great Lakes Environmental Research Lab, scientists are working with the Cleveland Water Department and other partners to prevent drinking water crises that can arise when oxygen levels in the lake get too low. Smart buoys stationed throughout Lake Erie take continuous measurements of dissolved oxygen levels, water temperature, pressure, wind speed and direction. That data is incorporated into NOAA models, which alert scientists to when oxygen levels are dangerously low and when that low-oxygen water is moving toward city water intakes. In the first year of the buoy deployment, the water district was able to adjust water treatment and save an estimated $1 million from changes in treatment strategy. But Scott Moegling, the city’s water manager, will tell you that customer confidence is priceless and improved confidence from the buoy data is invaluable.
In addition, GLERL works with NOAA Sea Grant and the Cooperative Institute for Great Lakes Research to understand and monitor harmful algal blooms across the Great Lakes. These blooms — which occur when algae grows out of control, coating the lakes in green slime — can contaminate drinking water, harm swimmers and pets, and pose a risk to the wildlife that live in and around the lakes. GLERL uses robotic tools, underwater vehicles, and planes to monitor these blooms and gather data for harmful algal bloom forecasts, which NOAA releases each year.
Invested in climate adaptation research
Understanding how the Earth is changing is key to both mitigating and adapting to that change. But relationships between scientists and decision-makers are also key to making that knowledge usable. Since the 1990s, the NOAA Regional Integrated Sciences and Assessments (RISA) program has funded research and engagement to help Americans prepare for climate impacts on economies and communities. The Network has grown to eleven RISA teams working with governments, resource managers, tribes, and businesses to co-develop local solutions to droughts, floods, wildfires and other local impacts of climate change. So far, these RISA teams have served more than 400 communities, informed hundreds of local plans and policies, generated new research, and coordinated partnerships that promote social resilience.
Take extreme heat. As climate change leads to increased temperatures and more severe heat waves in many parts of the world, RISA teams are working with local governments and communities to develop plans and tools to protect residents from dangerously high temperatures. For instance, the Northeast RISA team created a forecast tool that allows New York City officials to see a 24-hour advance prediction of mid-afternoon temperatures, and designed a social vulnerability map to understand where heat would have the greatest impact. With this information, city officials can warn at-risk residents — such as the elderly and those who lack air conditioning — about the heat risk, increase communication about the availability of public cooling centers, and more.
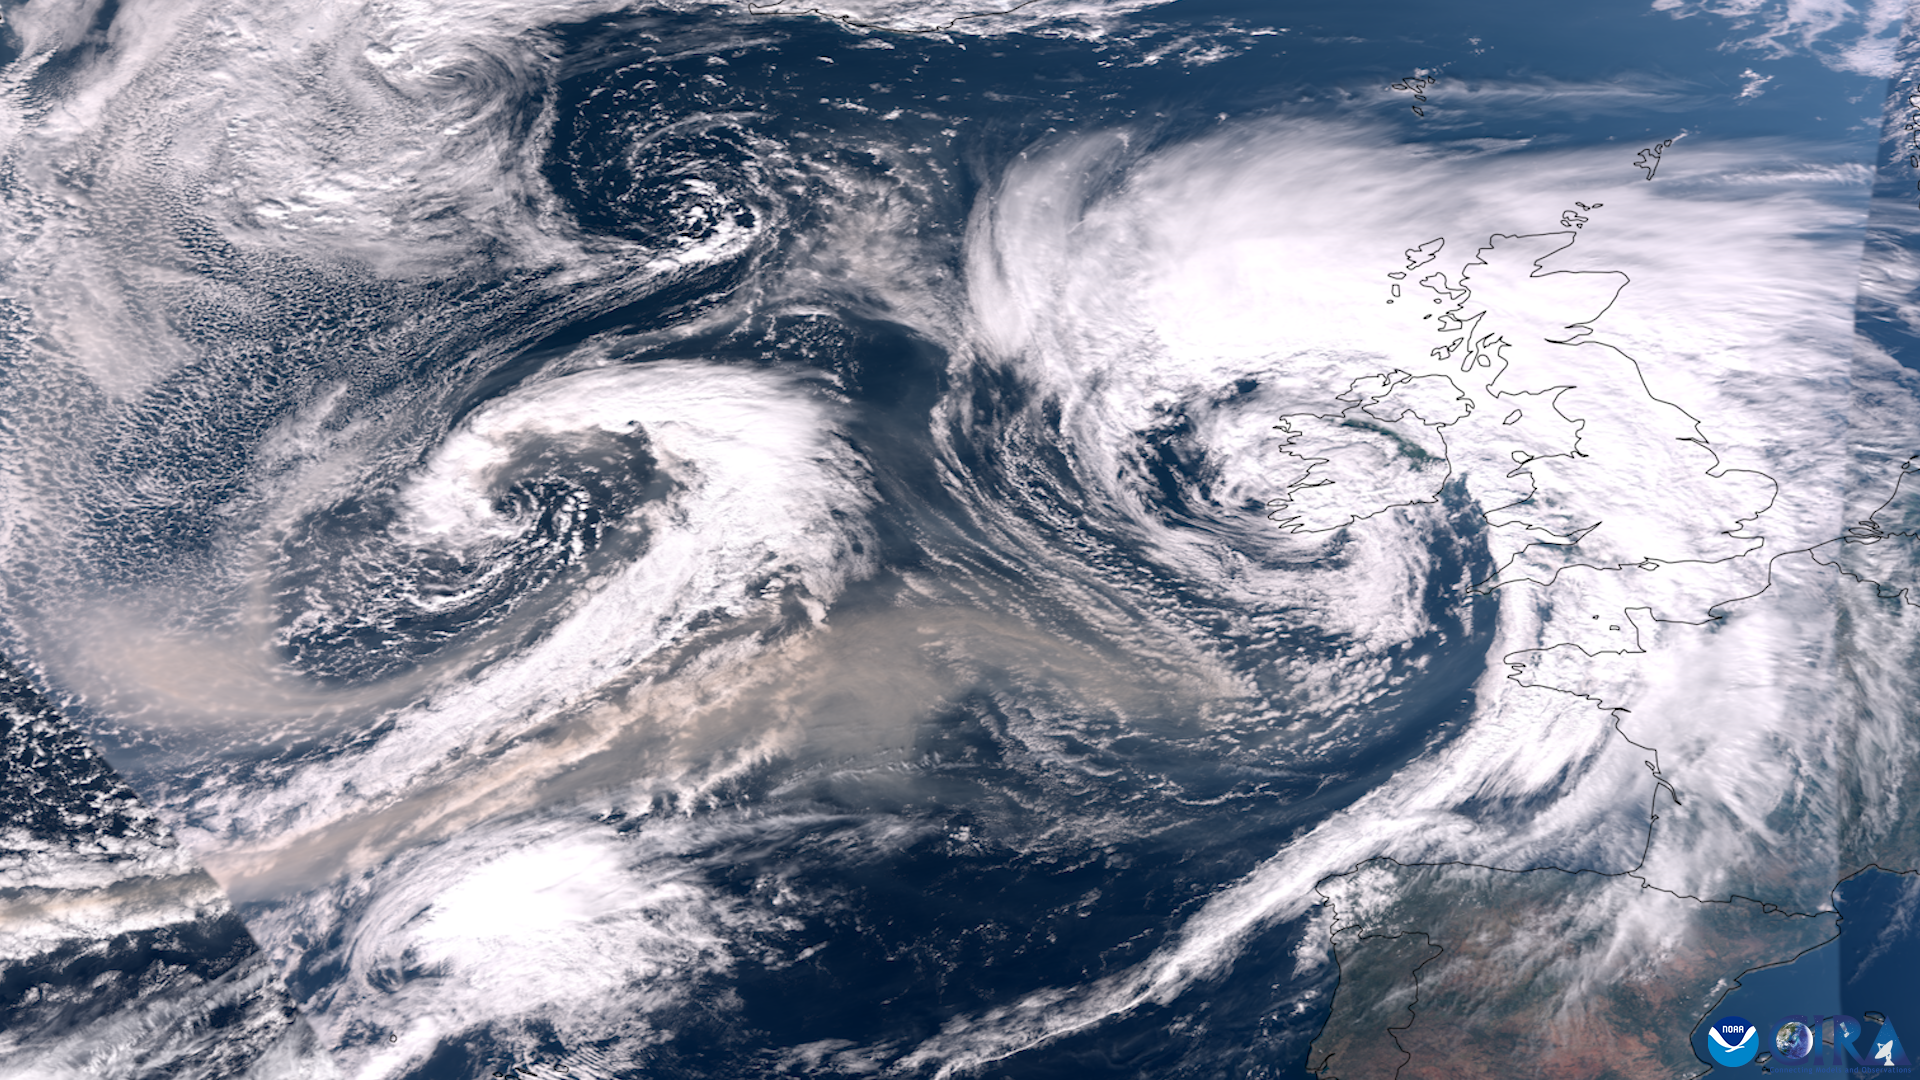
Ramped up our efforts to track carbon dioxide in the atmosphere…
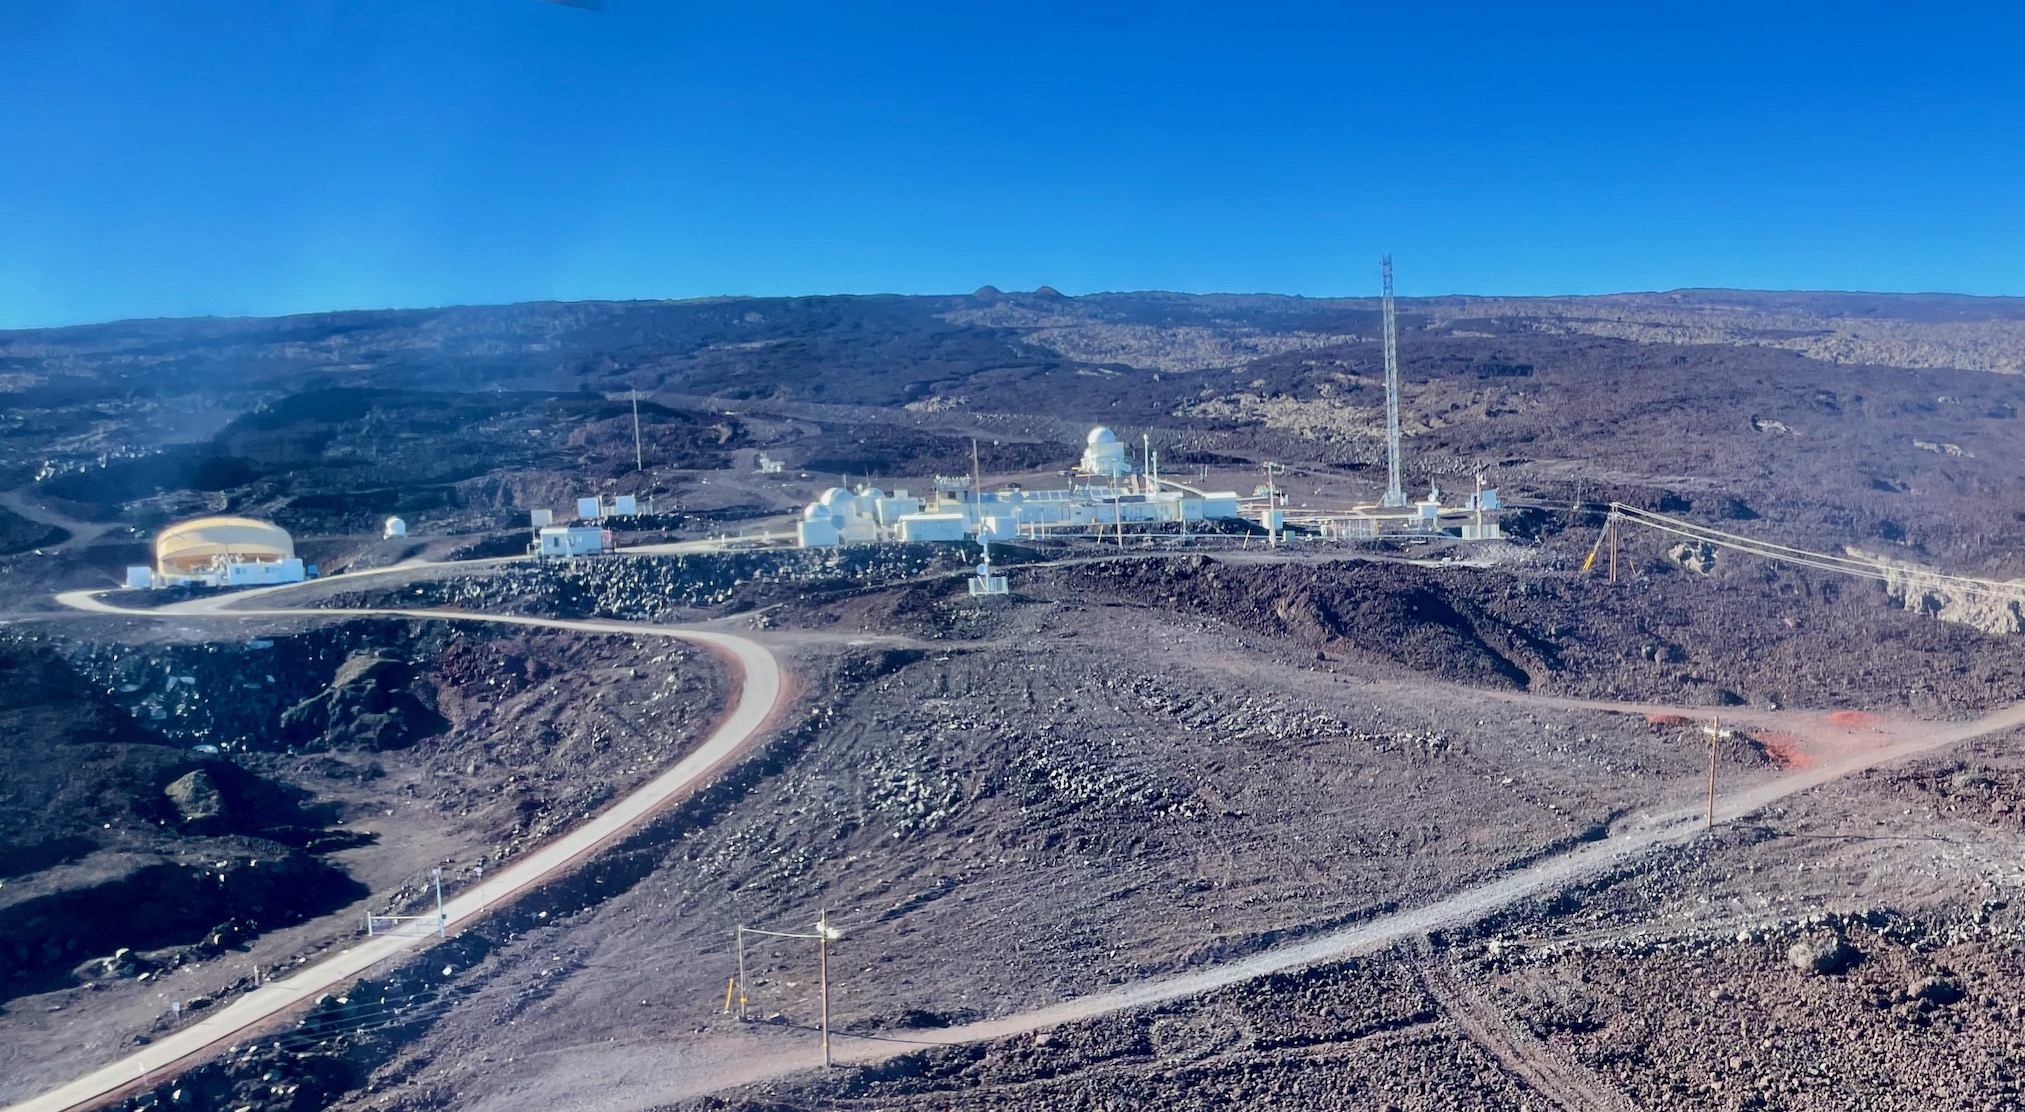
NOAA officially formed on October 3, 1970. Soon after, scientists got to work to increase our ability to measure carbon dioxide in the atmosphere. Two atmospheric observatories — the South Pole Observatory and the Mauna Loa Observatory on the Big Island of Hawaii — were established in the 1950s, before NOAA’s official creation. But in 1973 and 1974, NOAA created two more atmospheric observatories — one in Barrow (now Utqiaġvik) Alaska and one in American Samoa.
These four observatories monitor greenhouse gases and other components of the Earth’s atmosphere, creating a record of how carbon dioxide, methane and more have increased over time. Data from the Barrow Observatory, for instance, was key in a 2017 study that found the amount of carbon dioxide being released from tundra in northern Alaska during early winter had increased 70 percent since 1975. Knowing that increase in CO2 levels helps scientists better understand and predict climate change and its cascading impacts on communities, economies and the environment.
…And in the ocean
About 31 percent of the carbon dioxide (CO2) emitted into the atmosphere is absorbed by the ocean, so NOAA has ramped up efforts to monitor ocean CO2 levels — and the consequences they have on the marine environment. Scientists at NOAA are looking to understand how quickly the ocean chemistry is changing, how much that change varies from region to region, and what impacts that change is having on the ocean, the creatures that live there, and the economies that depend on a healthy ocean. As part of that effort, NOAA's Ocean Acidification Program was established in 2011.
One way NOAA keeps track of ocean carbon levels is through a network of buoys stationed around U.S. and territory coasts. These buoys collect data on surface water carbon dioxide levels, temperature, oxygen and more. This information allows NOAA scientists to keep track of the health of these coral reefs and other valuable marine ecosystems, and can help coastal communities make management decisions. A current Ocean Acidification Program study, for instance, is looking at whether underwater eel grass could help mitigate the impact of ocean acidification on Eastern oysters by reducing the acidity of their environment. Once the project is complete, an online modeling tool will be made available for scientists, managers and oyster growers to see how useful seagrass could be for their oyster populations. This research isn’t limited to the Eastern U.S. — on the West Coast, NOAA Sea Grant supported a similar study on seagrass and whether it could help protect local shellfish from ocean acidification.
The last 50 years have brought us a lot of data, and that data has informed critical environmental research. As innovations improve our data-collecting techniques, we’re sure the next 50 years will bring more scientific discoveries — and more knowledge about how to protect our planet.