Monthly average surpassed 414 parts per million at Mauna Loa observatory
Atmospheric carbon dioxide continued its rapid rise in 2019, with the average for May peaking at 414.7 parts per million at NOAA’s Mauna Loa Atmospheric Baseline Observatory, scientists from NOAA and Scripps Institution of Oceanography at the University of California San Diego announced today.
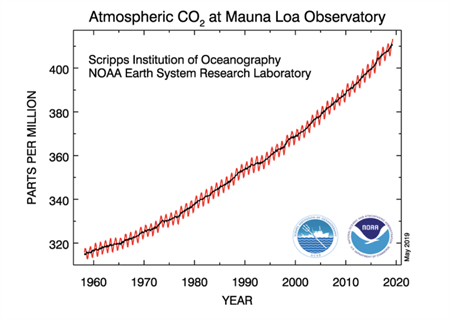
This is the highest seasonal peak recorded in 61 years of observations on top of Hawaii’s largest volcano, and the seventh consecutive year of steep global increases in concentrations of carbon dioxide, or CO2. The 2019 peak value was 3.5 parts per million (ppm) higher than the 411.2 ppm peak reached in May 2018; it represents the second-highest annual jump on record. The May monthly average measured by Scripps’ instruments was 414.8 ppm, also 3.5 ppm higher than Scripps’ May 2018 average.
Monthly CO2 values at Mauna Loa first breached the 400 ppm threshold in 2014.
Scientists studying how greenhouse gas pollution is changing the planet’s climate and ocean closely track levels of CO2, the most important anthropogenic greenhouse gas.
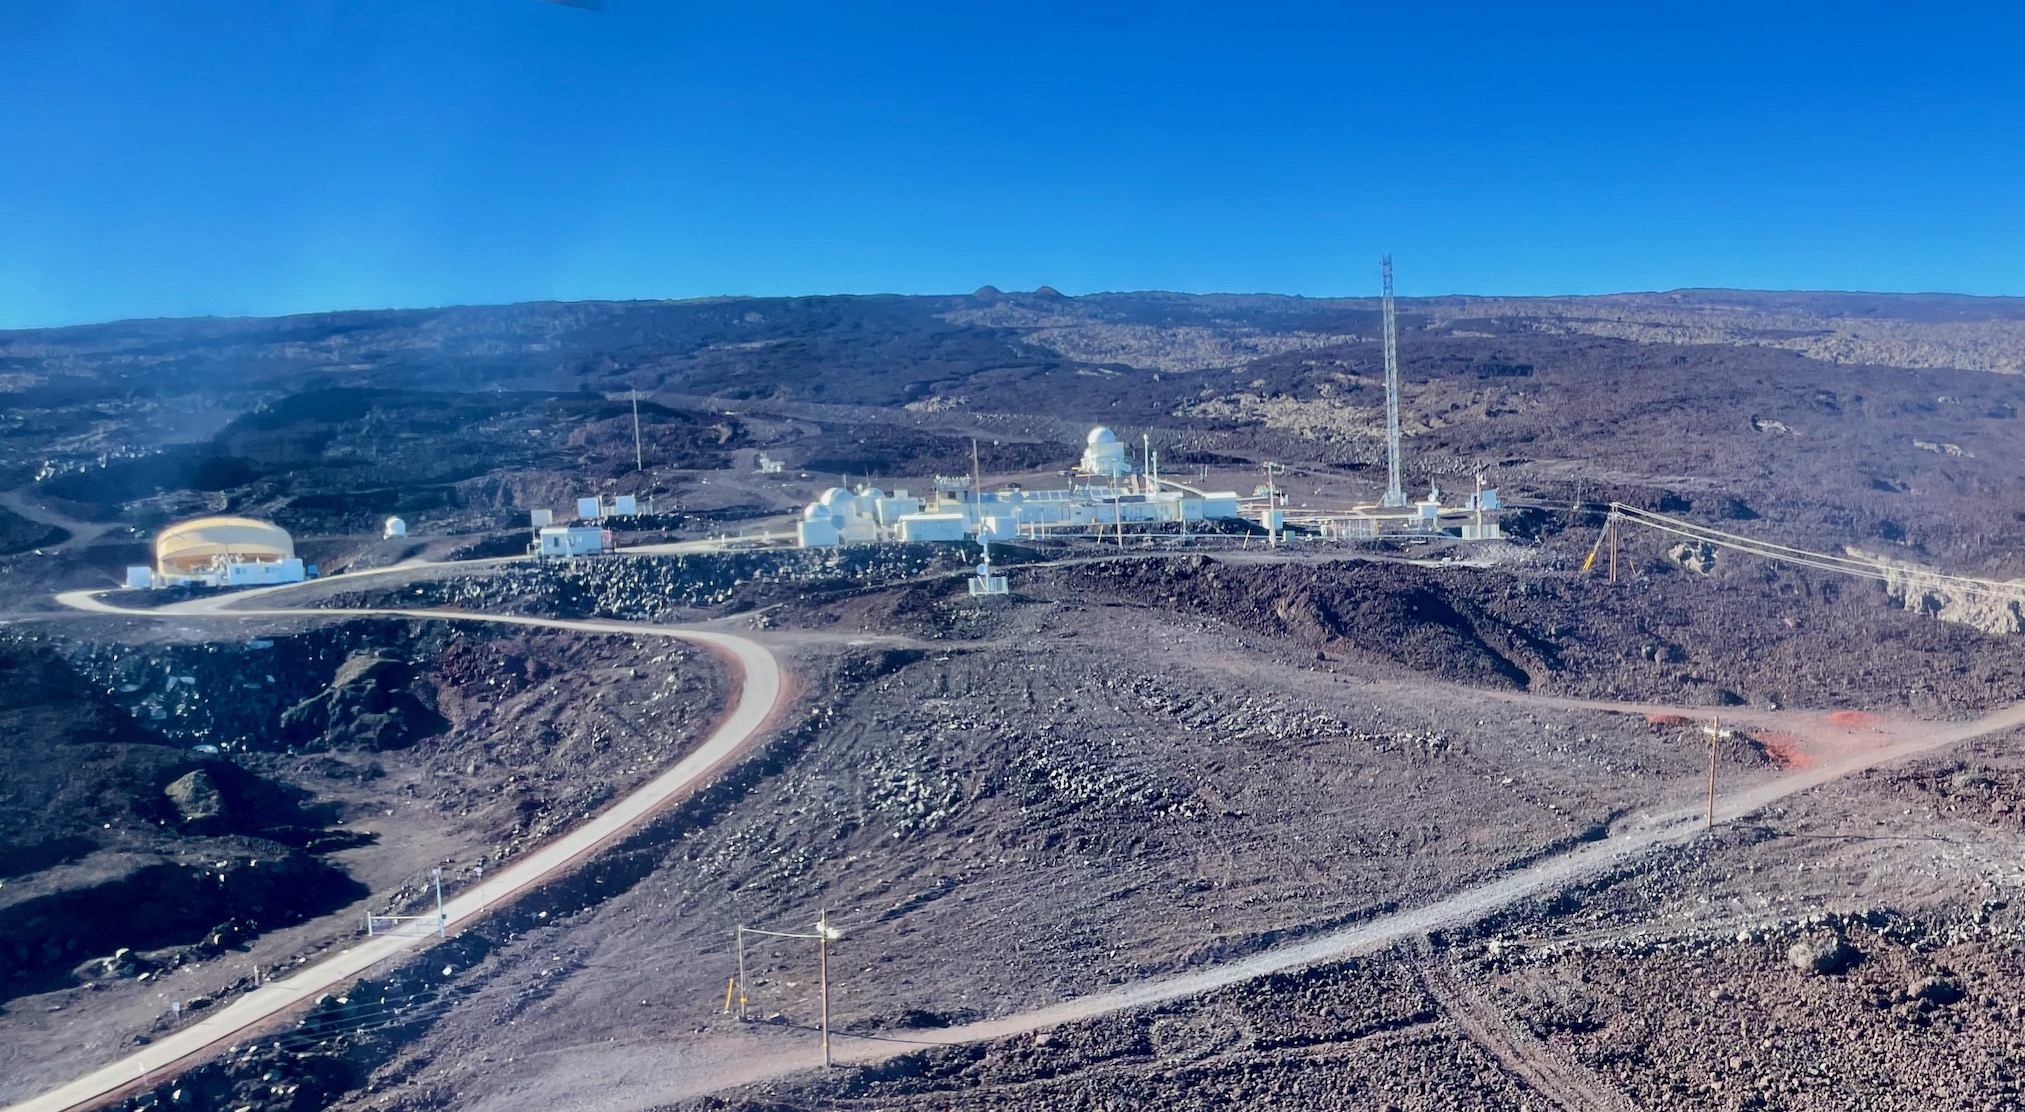
Charles David Keeling of Scripps initiated on-site CO2 measurements at NOAA’s weather station on Mauna Loa in 1958. NOAA began CO2 measurements there in 1974, and the two research institutions have made complementary, independent measurements ever since. The Mauna Loa data, together with measurements from sampling stations around the world, are made by NOAA’s Global Greenhouse Gas Reference Network, producing a foundational research dataset for international climate science.
“It’s critically important to have these accurate, long-term measurements of CO2 in order to understand how quickly fossil fuel pollution is changing our climate,” said Pieter Tans, senior scientist with NOAA’s Global Monitoring Division. “These are measurements of the real atmosphere. They do not depend on any models, but they help us verify climate model projections, which if anything, have underestimated the rapid pace of climate change being observed.”
The concentration of CO2 in the atmosphere increases every year, and the rate of increase is accelerating. The early years at Mauna Loa saw annual increases averaging about 0.7 ppm per year, increasing to about 1.6 ppm per year in the 1980s and 1.5 ppm per year in the 1990s. The growth rate rose to 2.2 ppm per year during the last decade. There is abundant and conclusive evidence that the acceleration is caused by increased emissions, Tans said.
The Keeling Curve
The highest monthly mean CO2 value of the year occurs in May, just before plants start to remove large amounts of CO2 from the atmosphere during the northern hemisphere growing season. In the northern fall, winter, and early spring, plants and soils give off CO2, causing levels to rise through May. Charles Keeling was the first to observe this seasonal rise and subsequent fall in CO2 levels embedded within annual increases, a cycle now known as the Keeling Curve. Keeling’s son, geochemist Ralph Keeling, now runs the Scripps program at Mauna Loa.
“CO2 growth rate is still very high,” said Ralph Keeling. “The increase from last May was 3.5 ppm, which is well above the average for the past decade. We’re likely seeing the effect of mild El Niño conditions on top of record fossil fuel use.”
Mauna Loa represents today’s northern hemisphere
The Mauna Loa observatory is a benchmark sampling location for CO2. Perched on a barren volcano in the middle of the Pacific Ocean, the observatory is ideally situated for sampling well-mixed air- undisturbed by the influence of local pollution sources or vegetation – that represents the northern hemisphere average. While Mauna Loa recorded a few daily readings above 415 ppm in May, readings from NOAA’s Barrow observatory on Alaska’s North Slope averaged 417.4 ppm that month. The Arctic typically has higher CO2 readings than Mauna Loa and provides a preview of future global average conditions.
“Many proposals have been made to mitigate global warming, but without a rapid decrease of CO2 emissions from fossil fuels they are pretty much futile,” Tans said.
For more information, please contact Theo Stein, NOAA Communications, at 303-497-6288 or theo.stein@noaa.gov, or Monica Allen, Director of Public Affairs at NOAA’s Oceanic and Atmospheric Research, at 301-734-1123 or monica.allen@noaa.gov.